flowchart TD

  subgraph R_Env ["R Environment (>= 4.3)"]
    R_Core[R Language]
    R_Pkgs["sf, sfnetworks, dodgr,<br>osmextract, tmap, mapgl"]
  end

  subgraph Py_Env ["Python Environment (>= 3.10)"]
    Py_Core[Python / Pixi]
    Py_Pkgs["geopandas, osmnx, osm2gmns,<br>grid2demand, networkx"]
  end

  subgraph Data_Layer ["Data & Storage Layer"]
    DuckDB[(DuckDB Engine)]
    Files[Parquet / CSV Files]
  end

  subgraph Runtime ["Runtime & Virtualization"]
    Docker[Docker Container]
    Codespaces[GitHub Codespaces]
  end

  OS[Linux OS: Debian]

  Q --> R_Core
  Q --> Py_Core
  R_Core --> R_Pkgs
  Py_Core --> Py_Pkgs
  R_Pkgs --> DuckDB
  Py_Pkgs --> DuckDB
  DuckDB --> Files
  Files --> Docker
  Docker --> Codespaces
  Codespaces --> OS
Transport Data Science
From origin-destination to route network datasets
By Robin Lovelace and Juan Fonseca
From the Institute for Transport Studies (ITS), University of Leeds
For Mobile Tartu 2026
Slides: tdscience.github.io/tartu26
code:github.com/tdscience/tartu26
From the Institute for Transport Studies (ITS), University of Leeds
For Mobile Tartu 2026
Slides: tdscience.github.io/tartu26
code:github.com/tdscience/tartu26
Delivery Team
- Robin Lovelace
Professor of Transport Data Science, University of Leeds - Juan Fonseca
PhD Candidate, University of Leeds

Agenda
Day 1: Sunday, June 7
- 14:00–18:00 – Practical Workshop Session 1 (with coffee break)
- Finding and importing data with {spanishoddata} Kotov et al. (2026)
- Origin-destination analysis
- Group work
Day 2: Monday, June 8
- 09:00–12:30 – Practical Workshop Session 2
- Routing and route networks
- Advanced topics
- 12:30–13:30 – Lunch & Workshop Wrap-up
What research questions and policy needs can be addressed with origin-destination and route network datasets?
- Unanswered questions in transport research
- Policy needs in transport planning and management, e.g. (Mahfouz et al. 2025)
- Specific policies and roles, e.g. transport planning officer in local government
Example of OD-level analysis
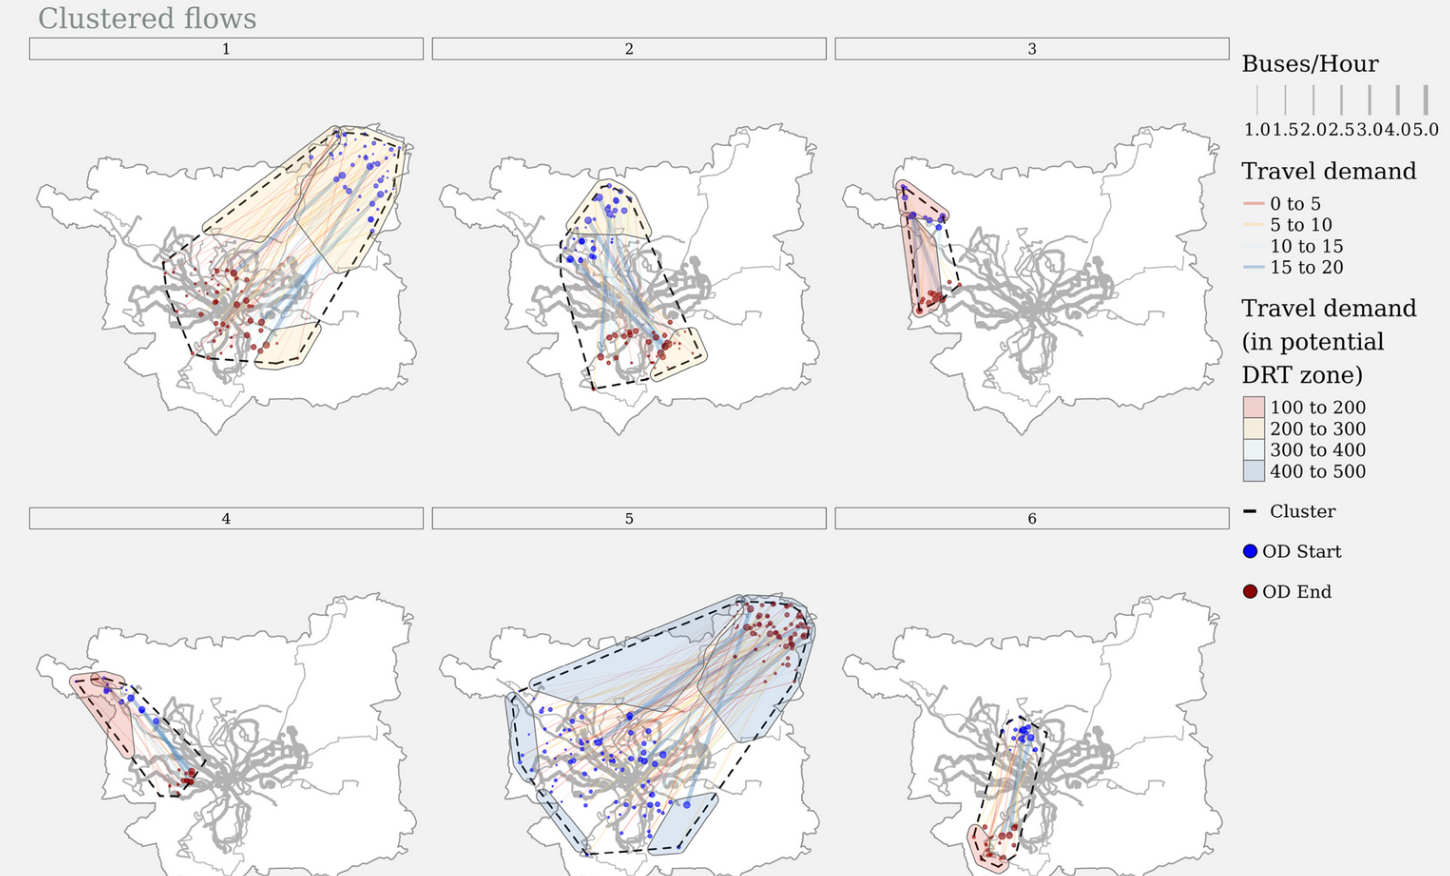
Results of clustering OD pairs to identify potential DRT operation sites (Mahfouz et al. 2025)
Example of network-level analysis
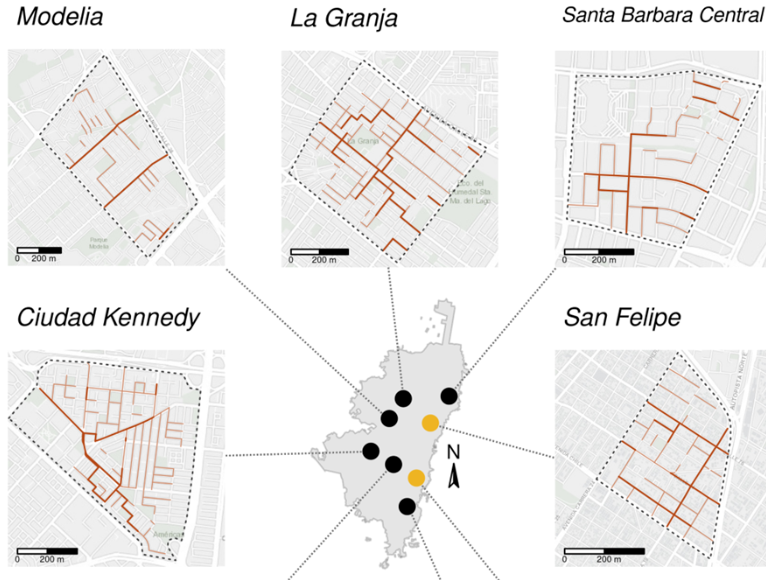
Potential cut-through routes identified by examining differences in centrality during rush-hours. Credit: Juan Fonseca.
Research question ideas
- What factors contribute to greater and lesser mobility connections between places (including and in addition to national borders and The Pyrenees, outlined in the workbook)?
- To what extent does the transport network reflect flows between places? (And is there any evidence that the transport network is more a cause or a consequence of flows?)
- Can transport system features such as high-speed rail in Spain be detected in the OD data?
Specific questions related to the workbooks
- What are the main predictors of zonal flows and how can they be modelled?
- See the ‘jittering’ method and implementation in Rust as an example (Lovelace et al. 2022)
- How does the deterrence effect of the Spain-France border vary between weekdays and weekends?
- To what extent does road segment betweenness centrality predict the assigned traffic volumes from the routing model?
Technical/methodological ideas
- How can estimates of OD flows, e.g. those using the approaches in the Python workbook, be improved? Suggestion: try the {simodels} package in R.
- How can we better visualise OD flows and route networks? Try the package {od} in R for example.
- To what extent can the methods presented for Spain be applied to other contexts (you could find other OD or route network datasets, or use the methods to estimate OD flows in other contexts)?
- What other packages can be used to work with OD and route network datasets, and how do they compare to those used in the workbook?
- For UK analysis, the {debiasRdata} package provides observed and census MSOA OD data: github.com/de-bias/debiasRdata. See the MSOA OD data.
Group work
You will present your work in groups, there are no rules on who does what, but everyone should input.
See placeholder presentations in the workshop website.
Agenda, day 2 and 3
June 8, Monday (PhD School & Main Conference)
- 8:30–9:00 – Morning coffee
- 9:00–12:30 – Workshops
- 12:30–13:30 – Lunch for PhD School
- (13:30 onwards – Main Conference programme begins)
June 9, Tuesday (PhD School & Main Conference)
- 15:20–17:00 – Session 4: PhD School workshop presentations & Paper 4A
- 17:00–17:20 – PhD School diplomas
Key Links
- GitHub Repository: github.com/tdscience/tartu26
- Workshop Website: tdscience.github.io/tartu26
Datasets and Releases
All prepared datasets are published on the GitHub Releases page: github.com/tdscience/tartu26/releases.
- National Datasets (latest 7 days):
- OD flow data:
od-data-week-national.parquet(135.3 MiB) &od-data-week-national.rds(121.8 MiB) - Zone geometries:
zones-national.gpkg(26.1 MiB) &zones-national.rds(14.9 MiB)
- OD flow data:
Example of using age/gender data
Tip: if you add #| eval: false to a code chunk, you can write code that won’t be executed when the document is rendered. This is useful for showing code examples without running them.
In system shell:
Example of loading data with gh cli and R
Download a specific file:
[1] "date"                        "hour"
 [3] "id_origin"                   "id_destination"
 [5] "distance"                    "activity_origin"
 [7] "activity_destination"        "study_possible_origin"
 [9] "study_possible_destination"  "residence_province_ine_code"
[11] "residence_province_name"     "income"
[13] "age"                         "sex"
[15] "n_trips"                     "trips_total_length_km"
[17] "year"                        "month"
[19] "day"
[1] 82079949       19
Format Comparison
- Parquet (via
arrow/duckdb):- Pros: Highly compressed, extremely fast columnar reads, language-agnostic (R/Python/Julia).
- Cons: Requires additional packages/libraries to load.
- RDS (native R):
- Pros: Zero external dependencies, preserves R class types/geometries/metadata seamlessly.
- Cons: R-specific, slower/less optimized for huge datasets.
Editing quarto docs + demo
Illustration of visual mode
Press Ctrl+F4 or click on 3 dots in top right and select Visual Editor:
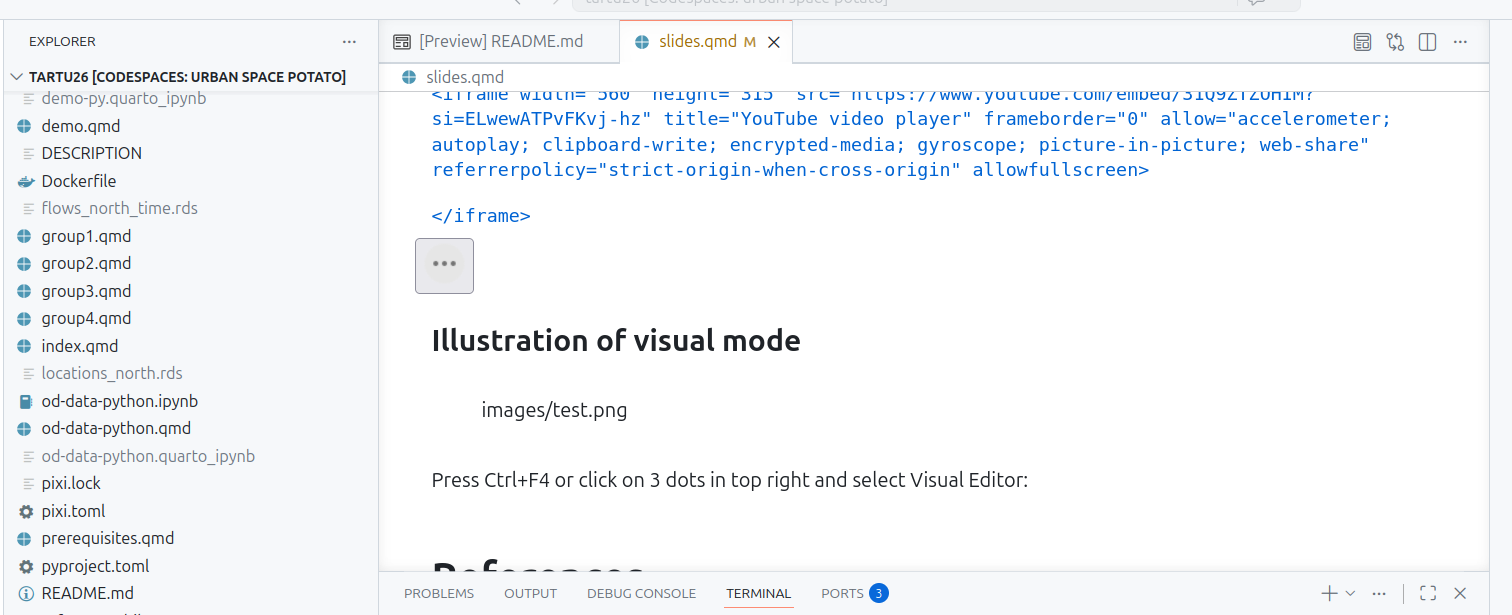
Demo of citations
Ctrl+Shift+F8 in visual mode:
References
Emma Rand. 2026. Reproducible Reports with Quarto. A UKRI Digital Research Skills Catalyst Workshop (Funded by UKRI/ST/B000299/1). March 3. https://doi.org/10.5281/ZENODO.18848356.
Kotov, Egor, Eugeni Vidal-Tortosa, Oliva G. Cantú-Ros, et al. 2026. “Spanishoddata: A Package for Accessing and Working with Spanish Open Mobility Big Data.” Environment and Planning B: Urban Analytics and City Science, January 17, 23998083251415040. https://doi.org/10.1177/23998083251415040.
Lovelace, Robin, Rosa Félix, and Dustin Carlino. 2022. “Jittering: A Computationally Efficient Method for Generating Realistic Route Networks from Origin-Destination Data.” Findings, ahead of print, April 8. https://doi.org/10.32866/001c.33873.
Mahfouz, Hussein, Malcolm Morgan, Eva Heinen, and Robin Lovelace. 2025. “Delineating Potential DRT Operating Areas: An Origindestination Clustering Approach.” Journal of Urban Mobility 8 (December): 100135. https://doi.org/10.1016/j.urbmob.2025.100135.