Team Members
- Jonas - Researcher / Intra-household interactions in mobility behaviour
- Helen - Researcher / Active mobility route choice
- Xiao - Researcher / Synthetic cycling flows
- Jaanika - Researcher / Social groups as lever for sustainable mobility change
- Keren Or - Researcher / Climate effects on travel mobility
Data
We used the following Datasets:
Selected Project Ideas
We all just tried out different things, but this are some questions we tried to answer:
- What trip purposes dominate for cross-border trips between Spain and France?
- How does a public transport strike effect bikesharing usage?
- How easy is it to get a routable cycling network from OpenStreetMap?
- How can we improve the performance of the existing grid-based OD flows workbook?
Trip purposes for cross-border trips between Spain and France
What is the dominant trip purpose (work/study-related, leisure) for the cross-border trips between Spain and France?
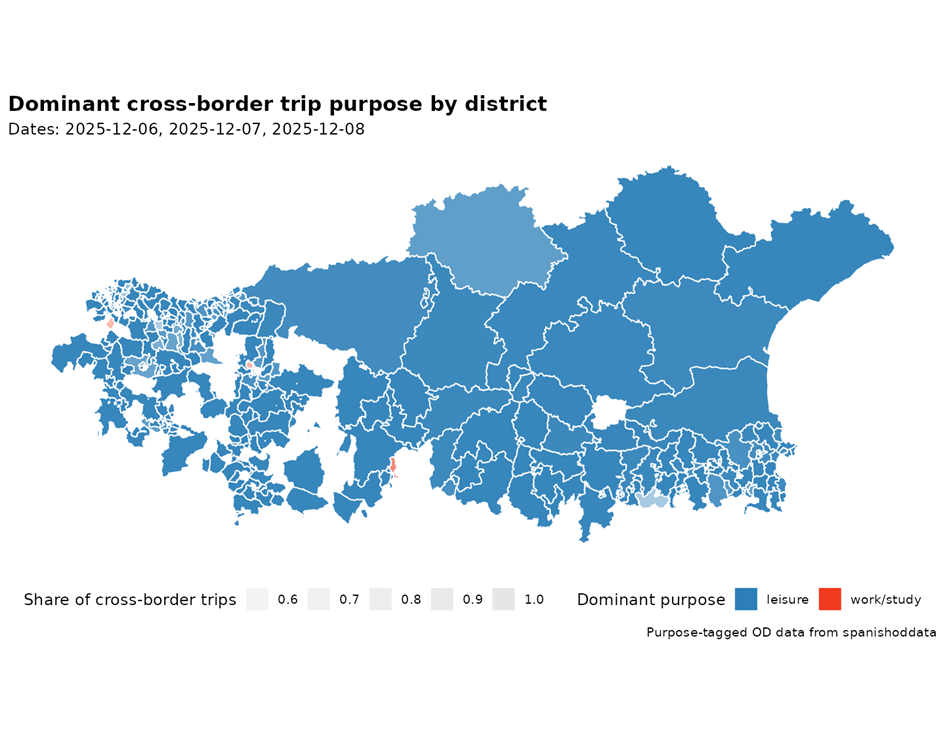
Trip purposes for cross-border trips between Spain and France
Same question using National OD week dataset (previous file version)

Influence of a public transport strike on bikesharing
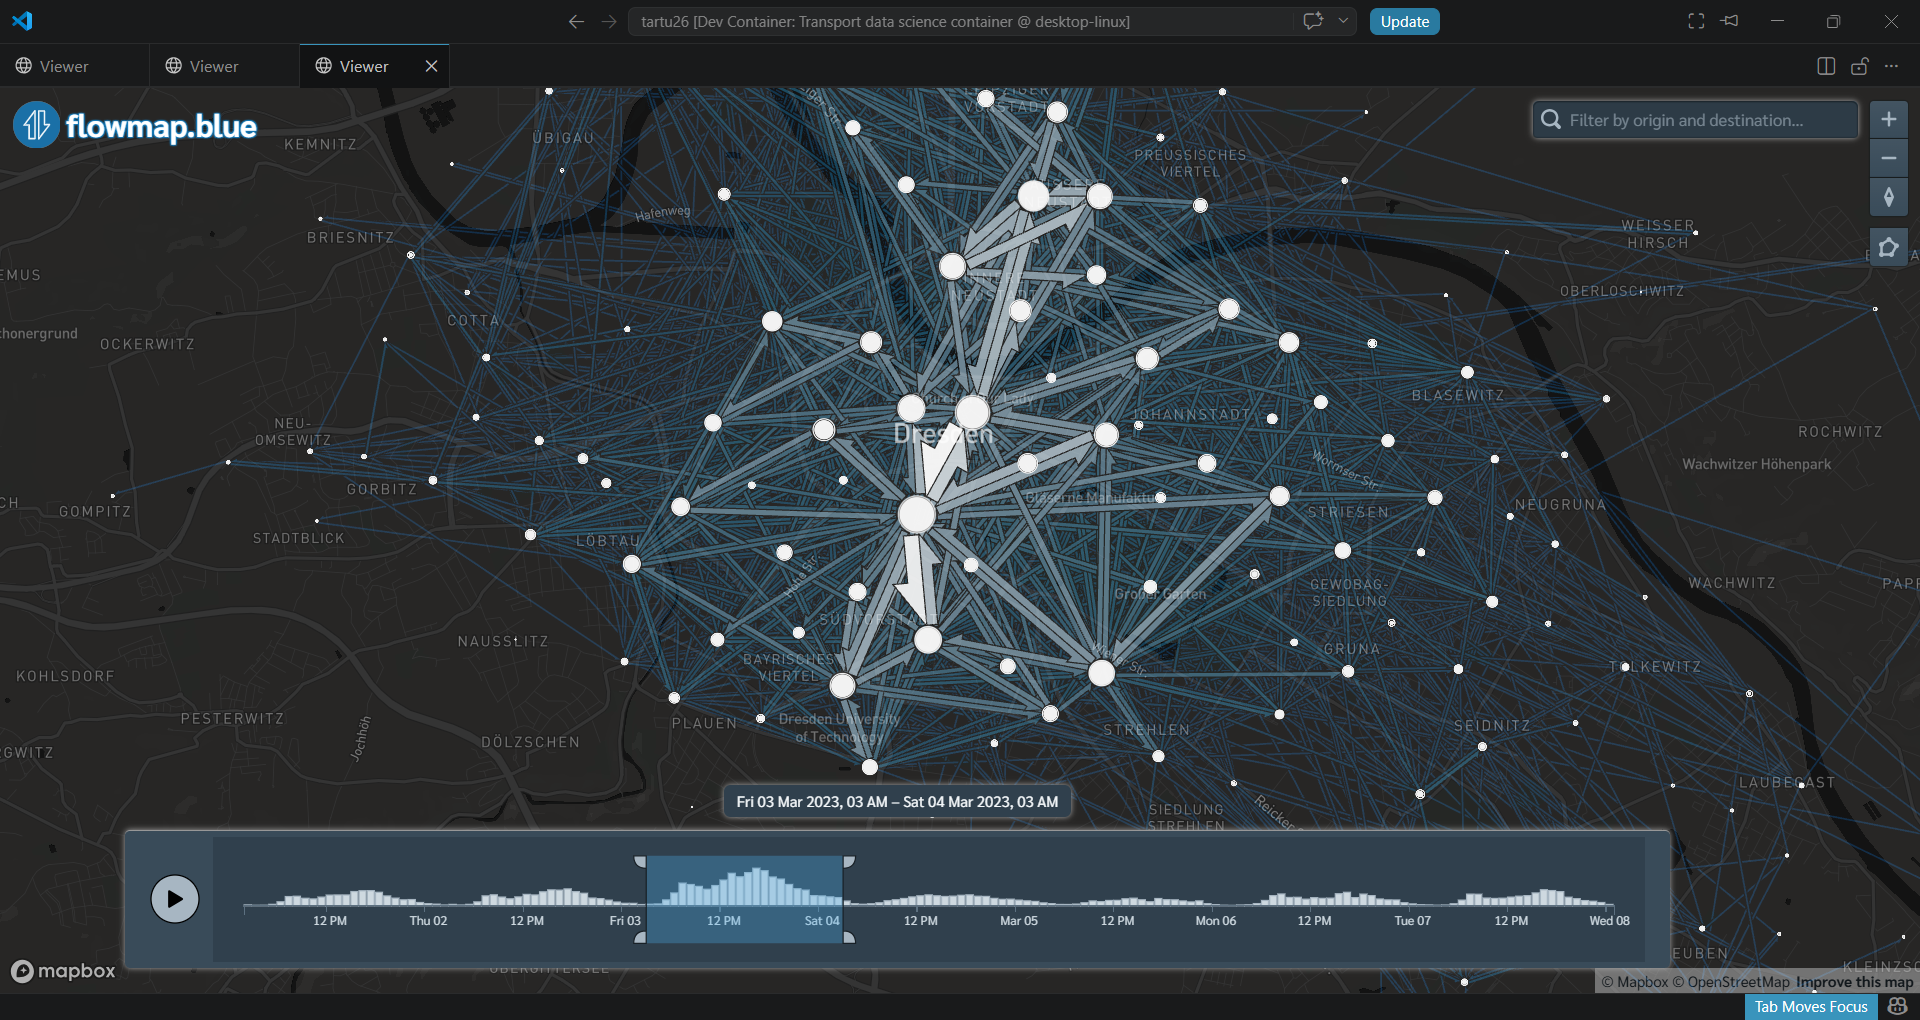
Aggregated origin-destination flows of bikesharing trips in Dresden on 2 March (“normal” Thursday)
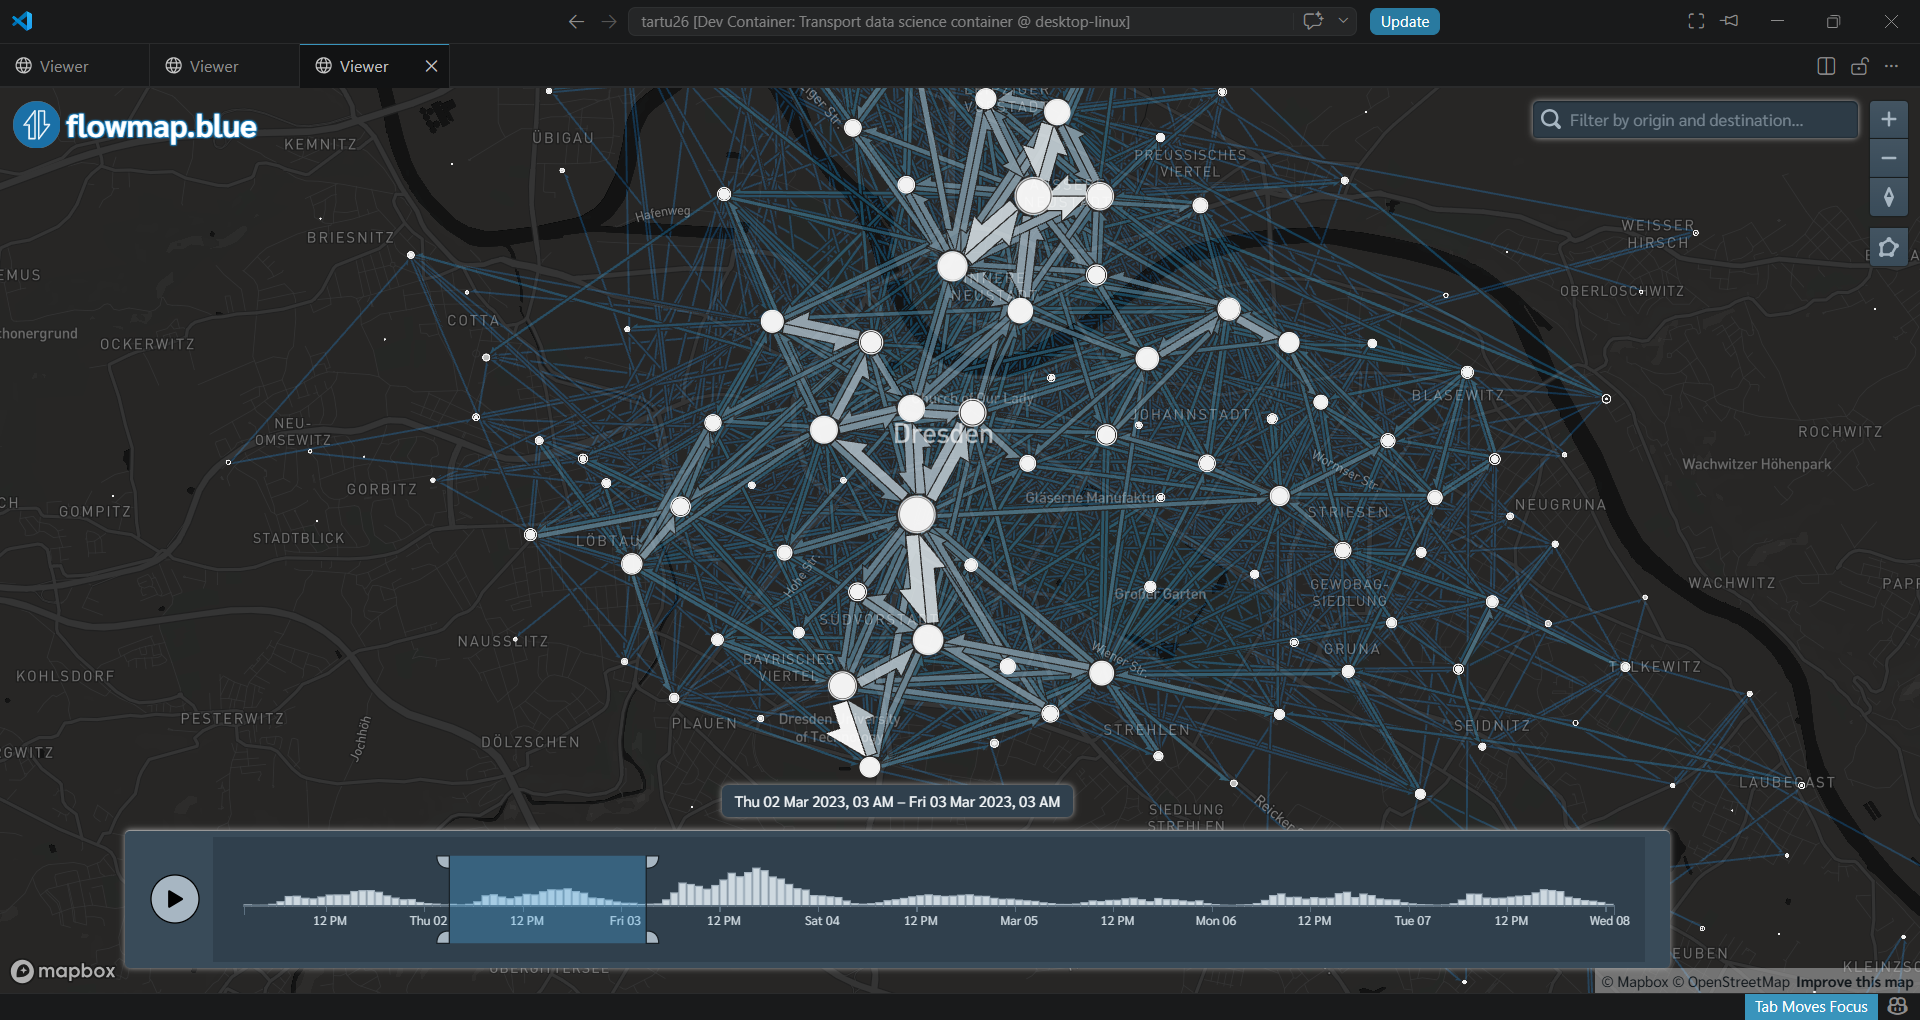
Influence of a public transport strike on bikesharing
Aggregated origin-destination flows of bikesharing trips in Dresden on 3 March (Friday, 24 h public transport strike)
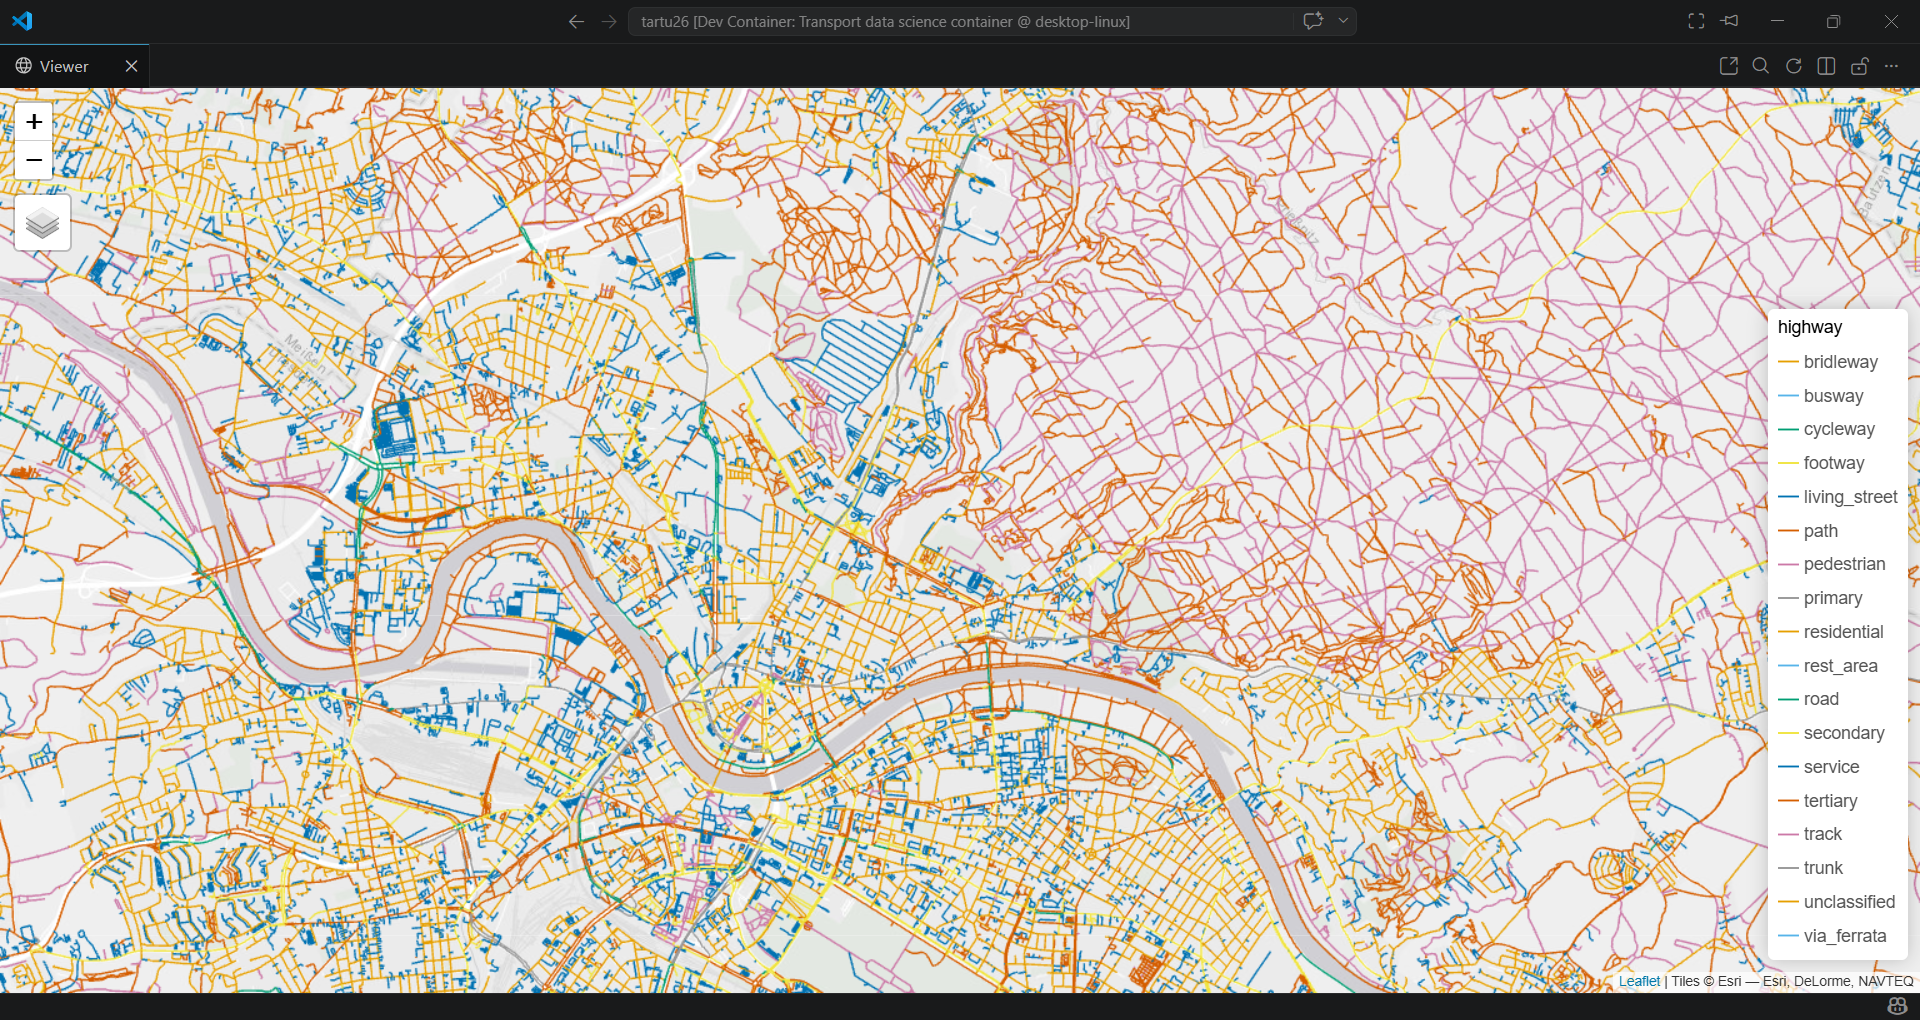
Generating a routable cycling network
This network took less than one hour to get with no previous knowledge of the osmextract package. And it looks quite reasonable, even though goo routing is another question.
![]()
Map of cyclable links in Dresden
OD-to-flows pipeline
- Grid-based OD estimation in Pamplona (
grid2demand)
- Demand dictated by POIs
- Validation results:
- Pearson correlation: 0.1
- Spearman correlation: 0.14
Improving the pipeline
- Experimenting with different parameters (e.g. scaling factor, number of flows included)
- Adding different POIs
Increasing the grid resolution
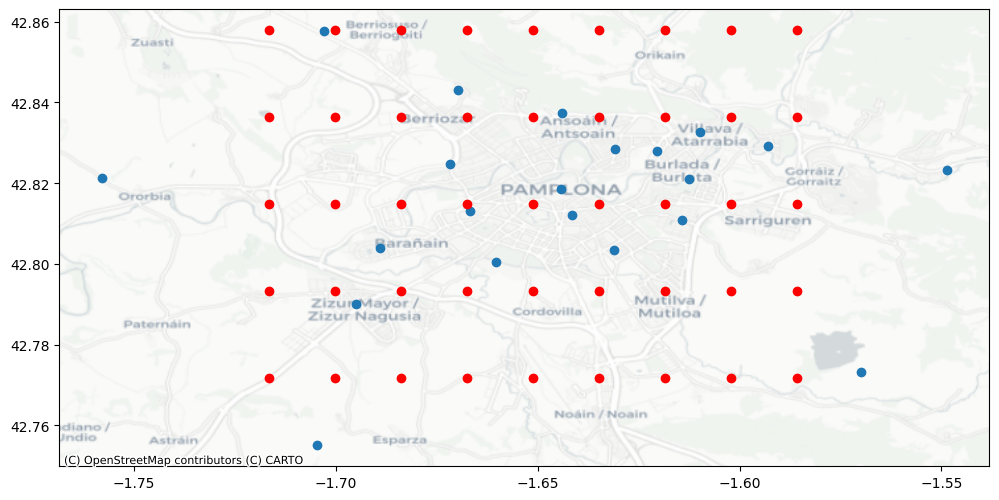
- Decreasing the grid resolution - 9x5
![]()
Grid centroids (red) vs validation zones (blue)
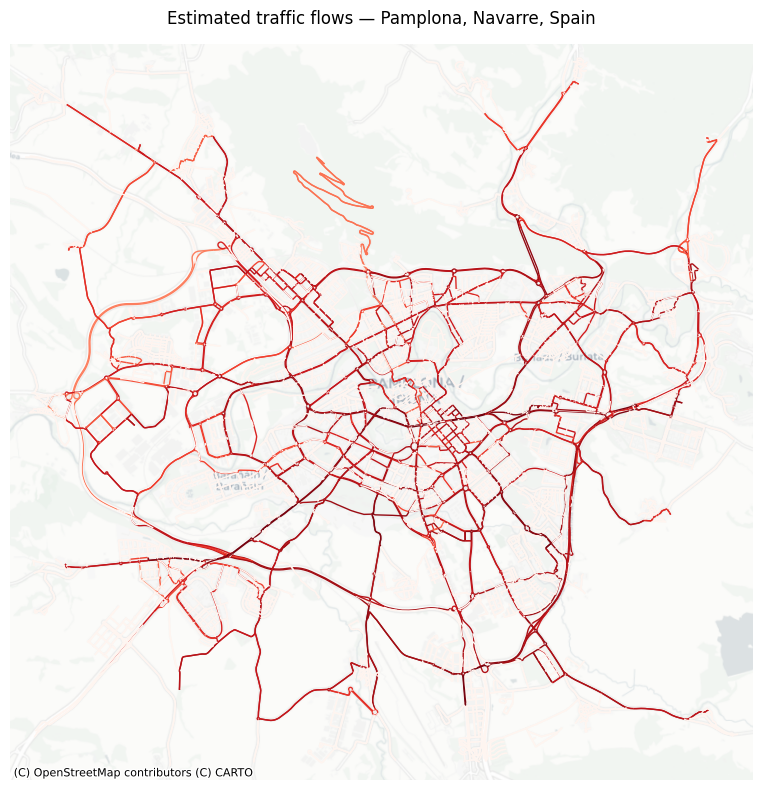
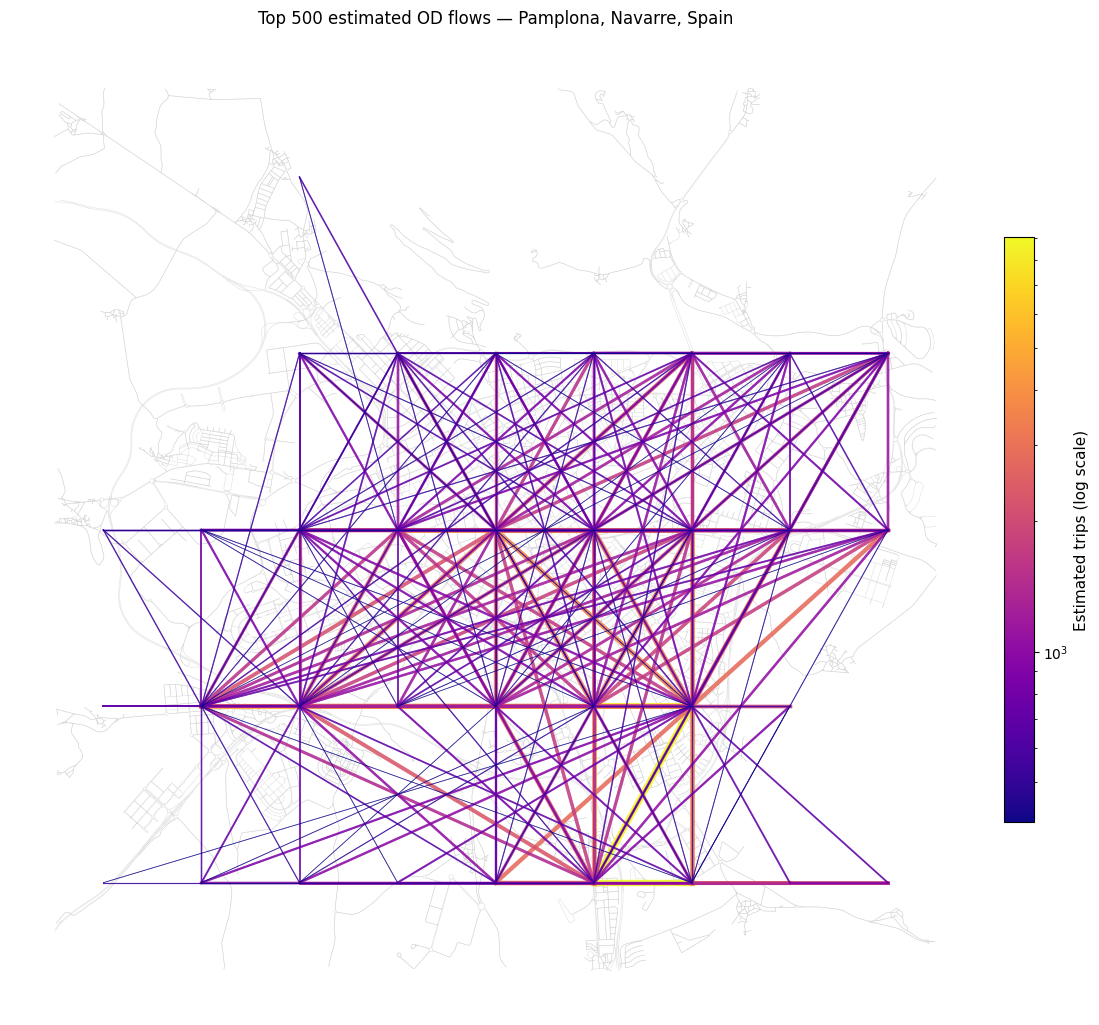
Estimated flows
![]()
Estimated OD-flows
Routed flows
![]()
Routed OD-flows
Validation results
Pearson correlation: 0.1 → 0.11
Spearman correlation: 0.14 → 0.39
Spearman correlation is improving, suggesting that the ranking of flows is more accurate
Further improvements: adjusting the scaling factor, aligning the grid with the validation zones, adding more POIs, etc.