Data Science for Transport Planning: Day 2
September 19, 2025
Welcome to Day 2!
Data Science for Transport Planning
2-day course
18-19 September 2025
Agenda
- 09:00-10:45 Spatio-temporal data
- 10:45-11:15 Break and refreshments
- 11:15-12:30 Routing and route network analysis
- 12:30-13:30 Lunch
- 13:30-15:00 Best practices for data science in transport planning
- 15:00-16:00 Advanced topics
Recap of Day 1
- Introduction to Data Science for Transport Planning
- Finding, importing and cleaning transport datasets
- Origin-destination data analysis
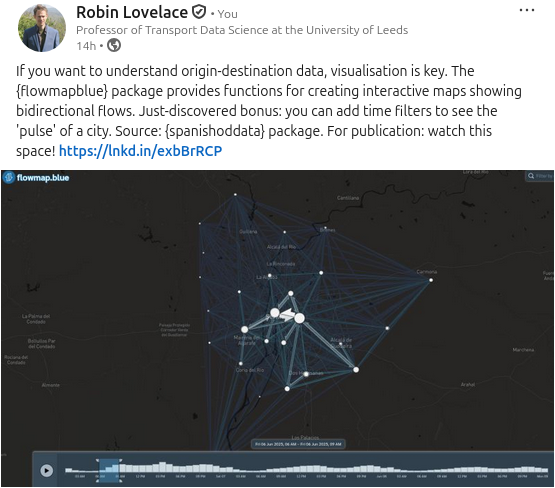
- OD Transport data visualisation
Let’s move to the practical sessions
See the schedule for details.
Any questions before we start?
Practical session 4: Spatio-temporal data
Practical 4 options
- Get stuck-into open access CDR (call detail records) data from Spain using the
spanishoddatapackage - Revisit the London Cycle Hire data from session 3.
- Explore changes in the spatial and temporal distrutions of road traffic collisions with stats19 package
- Bring your own data (BYOD)!
spanishoddata
Download a load of data from Spain!
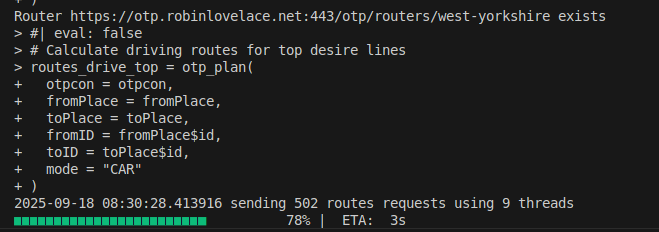
Practical session 5: Routing and route network analysis

Routing infrastructure
Routing costs
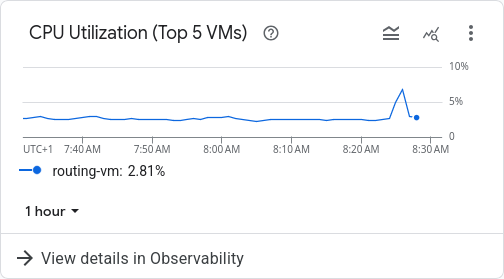
Routing Server Cost Summary
VM Configuration: - e2-medium instance (2 vCPUs, 4 GB RAM) - Spot pricing (60-90% discount) - Europe-west2 region
Estimated Daily Cost: - On-demand: ~$0.034/hour - Spot discount: ~70% = ~$0.010/hour - Per day (24h): ~$0.24
Monthly Estimate: ~$7-8
Additional Costs: - Disk storage: ~$0.04/month - Network egress: Free for 1 GB/day, then ~$0.12/GB - Spot interruptions possible but cost-effective for non-critical workloads
Prices approximate; use GCP Pricing Calculator for current rates.
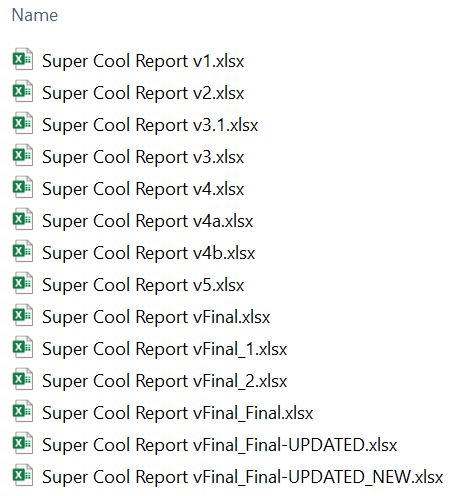
Practical session 6: Version control (Git+GitHub)
We do not need that for sure!
Version Control
Yes, we do…
Version control. From: programmerhumor.io
How does it look?
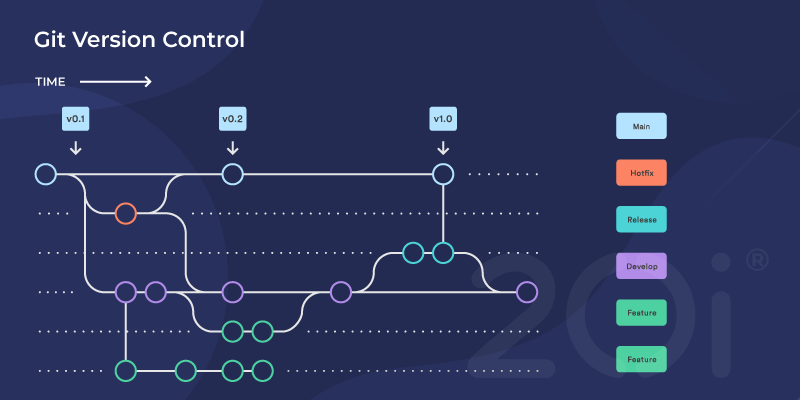
From 20i.com
Key terms
- Fork: Making a personal copu of a repository
- Clone: Downloading a full copy of a repository to your computer
- Pull : Fetches changes from the cloud to your local copy
- Commit: Saves a snapshot of your changes
- Push: Uploads your local commits
- Branch: A separate line of development in a repository.
- Pull request: Proposes your changes from a branch to be merged into the main project.
What we will be doing
- Forking a repository
- Cloning a repository (for those working locally)
- Creating an issue
- Creating a branch
- Making changes
- Committing changes
- Pushing changes
- Creating a PR
Feedback on the course
Please provide feedback on this forms.office.com/e/m102aC23ZD (should take less than 5 minutes):

Advanced topics
Visualising large datasets
- Install and try visualising datasets from previous sessions with:
mapgl: an R interface to Mapbox GL JS for rendering large spatial datasets.tmap.gl: Use your existingtmapcode, that builds onmapgl- The
nptscot/pmtilesGitHub package provides tools for creating vector tiles in R (advanced).
Route network integration
- Take a read of the networkmerge paper and try to reproduce some of the code
- Search for and download the Ordnance Survey’s OpenRoads data product
- Check-out the
stplanrfunctionrnet_join()for joining different route networks, e.g. walking and cycling networks. - Check-out the
animepackage for astonishingly fast network joining (advanced).
Deploying your work as web applications
- Think about the project that you’re working on that would have the maximum benefit from being deployed as a web application.
- Sketch out the user interface and user experience (UI/UX) of the application.
- Sketch the data flow and architecture of backend systems.
- Read-up on the
targetspackage for reproducible pipelines. - Take a look at the source code of some deployed web applications for inspiration
Example: Propensity to Cycle Tool (PCT)
The PCT is an open-source planning tool for cycling scenarios in England and Wales.
(Interactive map screenshot: Cycling potential layers over England and Wales, showing commute scenarios with color-coded routes)
- Interactive maps with Leaflet for route visualization
- Scenarios: Government Target, Go Dutch, Ebike
- Source: pct.bike, GitHub npct/pct
Best practice: Use Shiny for interactivity, open-source for collaboration, integrate with census data for evidence-based planning.
Example: Propensity to Cycle Tool for Northern Ireland (PCTNI)
Similar to PCT, adapted for Northern Ireland with OSM data.
(Interactive map screenshot: Route network layers for Northern Ireland, highlighting fastest/quietest cycling routes)
Layers for fastest/quietest routes, cycle networks
Based on 2011 Census, under active development
Check out the code in the
nptscot/nptscotandnptscot/nptscot.github.iorepositories, plus the resulting app at npt.scot.Look for the source code associated with other apps including pctni.org, pct.bike and other apps of your choice.